H-1B Analysis - 2025
- Tableau - Link For H-1B 2025 Approvals and Denials
- GitHub - Data Files For H-1B 2025 Approvals and Denials
Why?
After seeing a lot of news about H-1B, and its impacts. I wanted to do a data analysis based on the openly available data source from the US GOV site. Still I was not able to get the data which I expected to see, which actually would answer my questions such as:
- Impact of $100,000 H-1B Application Fee
- US Government Shutdown Impact
- Mass Layoffs and H-1B Hiring
- Investigation Into H-1B Abuse
- Geographic & Wage Shifts
Currently I would like to proceed with the data that is available on the USCIS GOV site and later take it forward with the other questions as and when the data is procurable.
- In this page only FY 2025 is covered.
Data Source
- https://www.uscis.gov/tools/reports-and-studies/h-1b-employer-data-hub
- The Excel file was downloaded following the steps mentioned in the site.
- Files downloaded on October 6th, 2025.
Cleaning & Data Preparation
- Downloaded the Employer data, and also the Archive data from the above links.
- Created a new database in SSMS -
[H-1B Analysis].
CREATE DATABASE [H-1B Analysis];
- Loaded the
Employer Information.xlsxinto a table -[dbo].['Employer Information']using the SQL Server Import and Export Wizard.- Confirmed 51852 rows of data was transferred, reference to the file in Notepad++.
- The line by line column was having
, commain the data, and hence the sort was not working as expected, it was nothing be to bothered, still wanted the data to be clean, hence replaced the comma using update function.
UPDATE [dbo].['Employer Information']
SET [Line by line] = REPLACE([Line by line], ',', '');
- Still the order did not change, hence had to change the column type from VARCHAR, which was assigned by default, to FLOAT.
ALTER TABLE [dbo].['Employer Information']
ALTER COLUMN [Line by line] FLOAT;
- Now the data was getting sorted correctly to be consumed.
- Checking if I had to preform any other modifications to other columns.
- Modified the column
[Fiscal Year ]by removing the additional spaces at the end of the column name. Using the Column Modify feature.
- Modified the column
Exploring the Data
[Employer (Petitioner) Name]
- Upon taking a count of
[Employer (Petitioner) Name]found only,43,494records.
SELECT DISTINCT [Employer (Petitioner) Name]
FROM [dbo].['Employer Information'];
---
SELECT COUNT(DISTINCT[Employer (Petitioner) Name]) AS [Employer (Petitioner) Name Count]
FROM [dbo].['Employer Information']; -- 43494
- Wanted to sort the count in a descending order.
SELECT [Employer (Petitioner) Name], COUNT(*) AS [Employer (Petitioner) Name Count]
FROM [dbo].['Employer Information']
GROUP BY [Employer (Petitioner) Name]
ORDER BY 2 DESC;
- Also wanted to check the top 10
[Employer (Petitioner) Name]
SELECT TOP 10
[Employer (Petitioner) Name], COUNT(*) AS [Count]
FROM [dbo].['Employer Information']
GROUP BY [Employer (Petitioner) Name]
ORDER BY 2 DESC;
| Employer (Petitioner) Name | Count |
|---|---|
| STATE UNIVERSITY OF NEW YORK AT BINGHAMTON | 32 |
| STATE UNIVERSITY OF NEW YORK AT BU | 20 |
| TATA CONSULTANCY SERVICES LIMITED | 15 |
| UNIVERSITY OF MARYLAND | 15 |
| ACCENTURE LLP | 14 |
| AMAZON COM SERVICES LLC | 14 |
| CEP AMERICA-ILLINOIS HOSPITALISTS, LLP DBA VITUITY | 14 |
| RESEARCH FOUNDATION FOR THE STATE UNIVERSITY OF NEW YORK | 14 |
| WIPRO LIMITED | 12 |
| ILLINOIS TOOL WORKS INC | 11 |
[Industry (NAICS) Code]
- Upon taking a count of
[Industry (NAICS) Code]found only,21records.
SELECT DISTINCT [Industry (NAICS) Code]
FROM [dbo].['Employer Information'];
---
SELECT COUNT(DISTINCT[Industry (NAICS) Code]) AS [Industry (NAICS) Code Count]
FROM [dbo].['Employer Information']; -- 21
- Wanted to sort the count in a descending order.
SELECT [Industry (NAICS) Code], COUNT(*) AS [Industry (NAICS) Code Count]
FROM [dbo].['Employer Information']
GROUP BY [Industry (NAICS) Code]
ORDER BY 2 DESC;
- Also wanted to check the top 5
[Industry (NAICS) Code]
SELECT TOP 5
[Industry (NAICS) Code], COUNT(*) AS [Count]
FROM [dbo].['Employer Information']
GROUP BY [Industry (NAICS) Code]
ORDER BY 2 DESC;
| Industry (NAICS) Code | Count |
|---|---|
| 54 - Professional, Scientific, and Technical Services | 22819 |
| 31-33 - Manufacturing | 5409 |
| 62 - Health Care and Social Assistance | 4379 |
| 52 - Finance and Insurance | 3135 |
| 61 - Educational Services | 2860 |
[Petitioner City], [Petitioner State], [Petitioner Zip Code]
- Upon taking a count of
[Petitioner City], [Petitioner State], [Petitioner Zip Code]found only,9223records.
SELECT DISTINCT [Petitioner City], [Petitioner State], [Petitioner Zip Code]
FROM [dbo].['Employer Information']
ORDER BY 2,1; -- 9223
---
SELECT COUNT(*) AS COUNT FROM (
SELECT DISTINCT [Petitioner City], [Petitioner State], [Petitioner Zip Code]
FROM [dbo].['Employer Information']
) A; -- 9223
[Petitioner City], [Petitioner State]
- Upon taking a count of
[Petitioner City], [Petitioner State]found only,5091records.
SELECT DISTINCT [Petitioner City], [Petitioner State]
FROM [dbo].['Employer Information']
ORDER BY 2,1; -- 5091
---
SELECT COUNT(*) AS COUNT FROM (
SELECT DISTINCT [Petitioner City], [Petitioner State]
FROM [dbo].['Employer Information']
) A; -- 5091
- Wanted to sort the count in a descending order.
SELECT [Petitioner City], [Petitioner State], COUNT(*) AS [Count]
FROM [dbo].['Employer Information']
GROUP BY [Petitioner City], [Petitioner State]
ORDER BY 3 DESC;
- Also wanted to check the top 10
[Petitioner City], [Petitioner State]
SELECT TOP 10
[Petitioner City], [Petitioner State], COUNT(*) AS [Count]
FROM [dbo].['Employer Information']
GROUP BY [Petitioner City], [Petitioner State]
ORDER BY 3 DESC;
| Petitioner City | Petitioner State | Count |
|---|---|---|
| Not Available | Not Available | 4590 |
| NEW YORK | NY | 3075 |
| SAN FRANCISCO | CA | 1248 |
| HOUSTON | TX | 924 |
| CHICAGO | IL | 894 |
| BOSTON | MA | 650 |
| DALLAS | TX | 527 |
| SAN JOSE | CA | 490 |
| IRVING | TX | 478 |
| ATLANTA | GA | 473 |
[Petitioner State]
- Upon taking a count of
[Petitioner State]found only,59records.
SELECT DISTINCT [Petitioner State]
FROM [dbo].['Employer Information']
ORDER BY 1; -- 59
---
SELECT COUNT(*) AS COUNT FROM (
SELECT DISTINCT [Petitioner State]
FROM [dbo].['Employer Information']
) A; -- 59
- Wanted to sort the count in a descending order.
SELECT [Petitioner State], COUNT(*) AS [Count]
FROM [dbo].['Employer Information']
GROUP BY [Petitioner State]
ORDER BY 2 DESC;
- Also wanted to check the top 10
[Petitioner State]
SELECT TOP 10
[Petitioner State], COUNT(*) AS [Count]
FROM [dbo].['Employer Information']
GROUP BY [Petitioner State]
ORDER BY 2 DESC;
| Petitioner State | Count |
|---|---|
| CA | 8372 |
| TX | 5101 |
| NY | 5003 |
| Not Available | 4592 |
| NJ | 3066 |
| IL | 2297 |
| MA | 2267 |
| FL | 2077 |
| VA | 1681 |
| GA | 1571 |
Remaining Columns
SELECT SUM([New Employment Approval]) AS [Total New Employment Approval]
FROM [dbo].['Employer Information']; -- 76812

SELECT SUM([New Employment Denial]) AS [Total New Employment Denial]
FROM [dbo].['Employer Information']; -- 2378

SELECT SUM([Continuation Approval]) AS [Total Continuation Approval]
FROM [dbo].['Employer Information']; -- 91982

SELECT SUM([Continuation Denial]) AS [Total Continuation Denial]
FROM [dbo].['Employer Information']; -- 1378

SELECT SUM([Continuation Denial]) AS [Total Continuation Denial]
FROM [dbo].['Employer Information']; -- 1378

SELECT SUM([Change with Same Employer Approval]) AS [Total Change with Same Employer Approval]
FROM [dbo].['Employer Information']; -- 31318

SELECT SUM([Change with Same Employer Denial]) AS [Total Change with Same Employer Denial]
FROM [dbo].['Employer Information']; -- 459

SELECT SUM([New Concurrent Approval]) AS [Total New Concurrent Approval]
FROM [dbo].['Employer Information']; -- 1067

SELECT SUM([New Concurrent Denial]) AS [Total New Concurrent Denial]
FROM [dbo].['Employer Information']; -- 58

SELECT SUM([Change of Employer Approval]) AS [Total Change of Employer Approval]
FROM [dbo].['Employer Information']; -- 50765

SELECT SUM([Change of Employer Denial]) AS [Total Change of Employer Denial]
FROM [dbo].['Employer Information']; -- 955

SELECT SUM([Amended Approval]) AS [Total Amended Approval]
FROM [dbo].['Employer Information']; -- 52180

SELECT SUM([Amended Denial]) AS [Total Amended Denial]
FROM [dbo].['Employer Information']; -- 1110
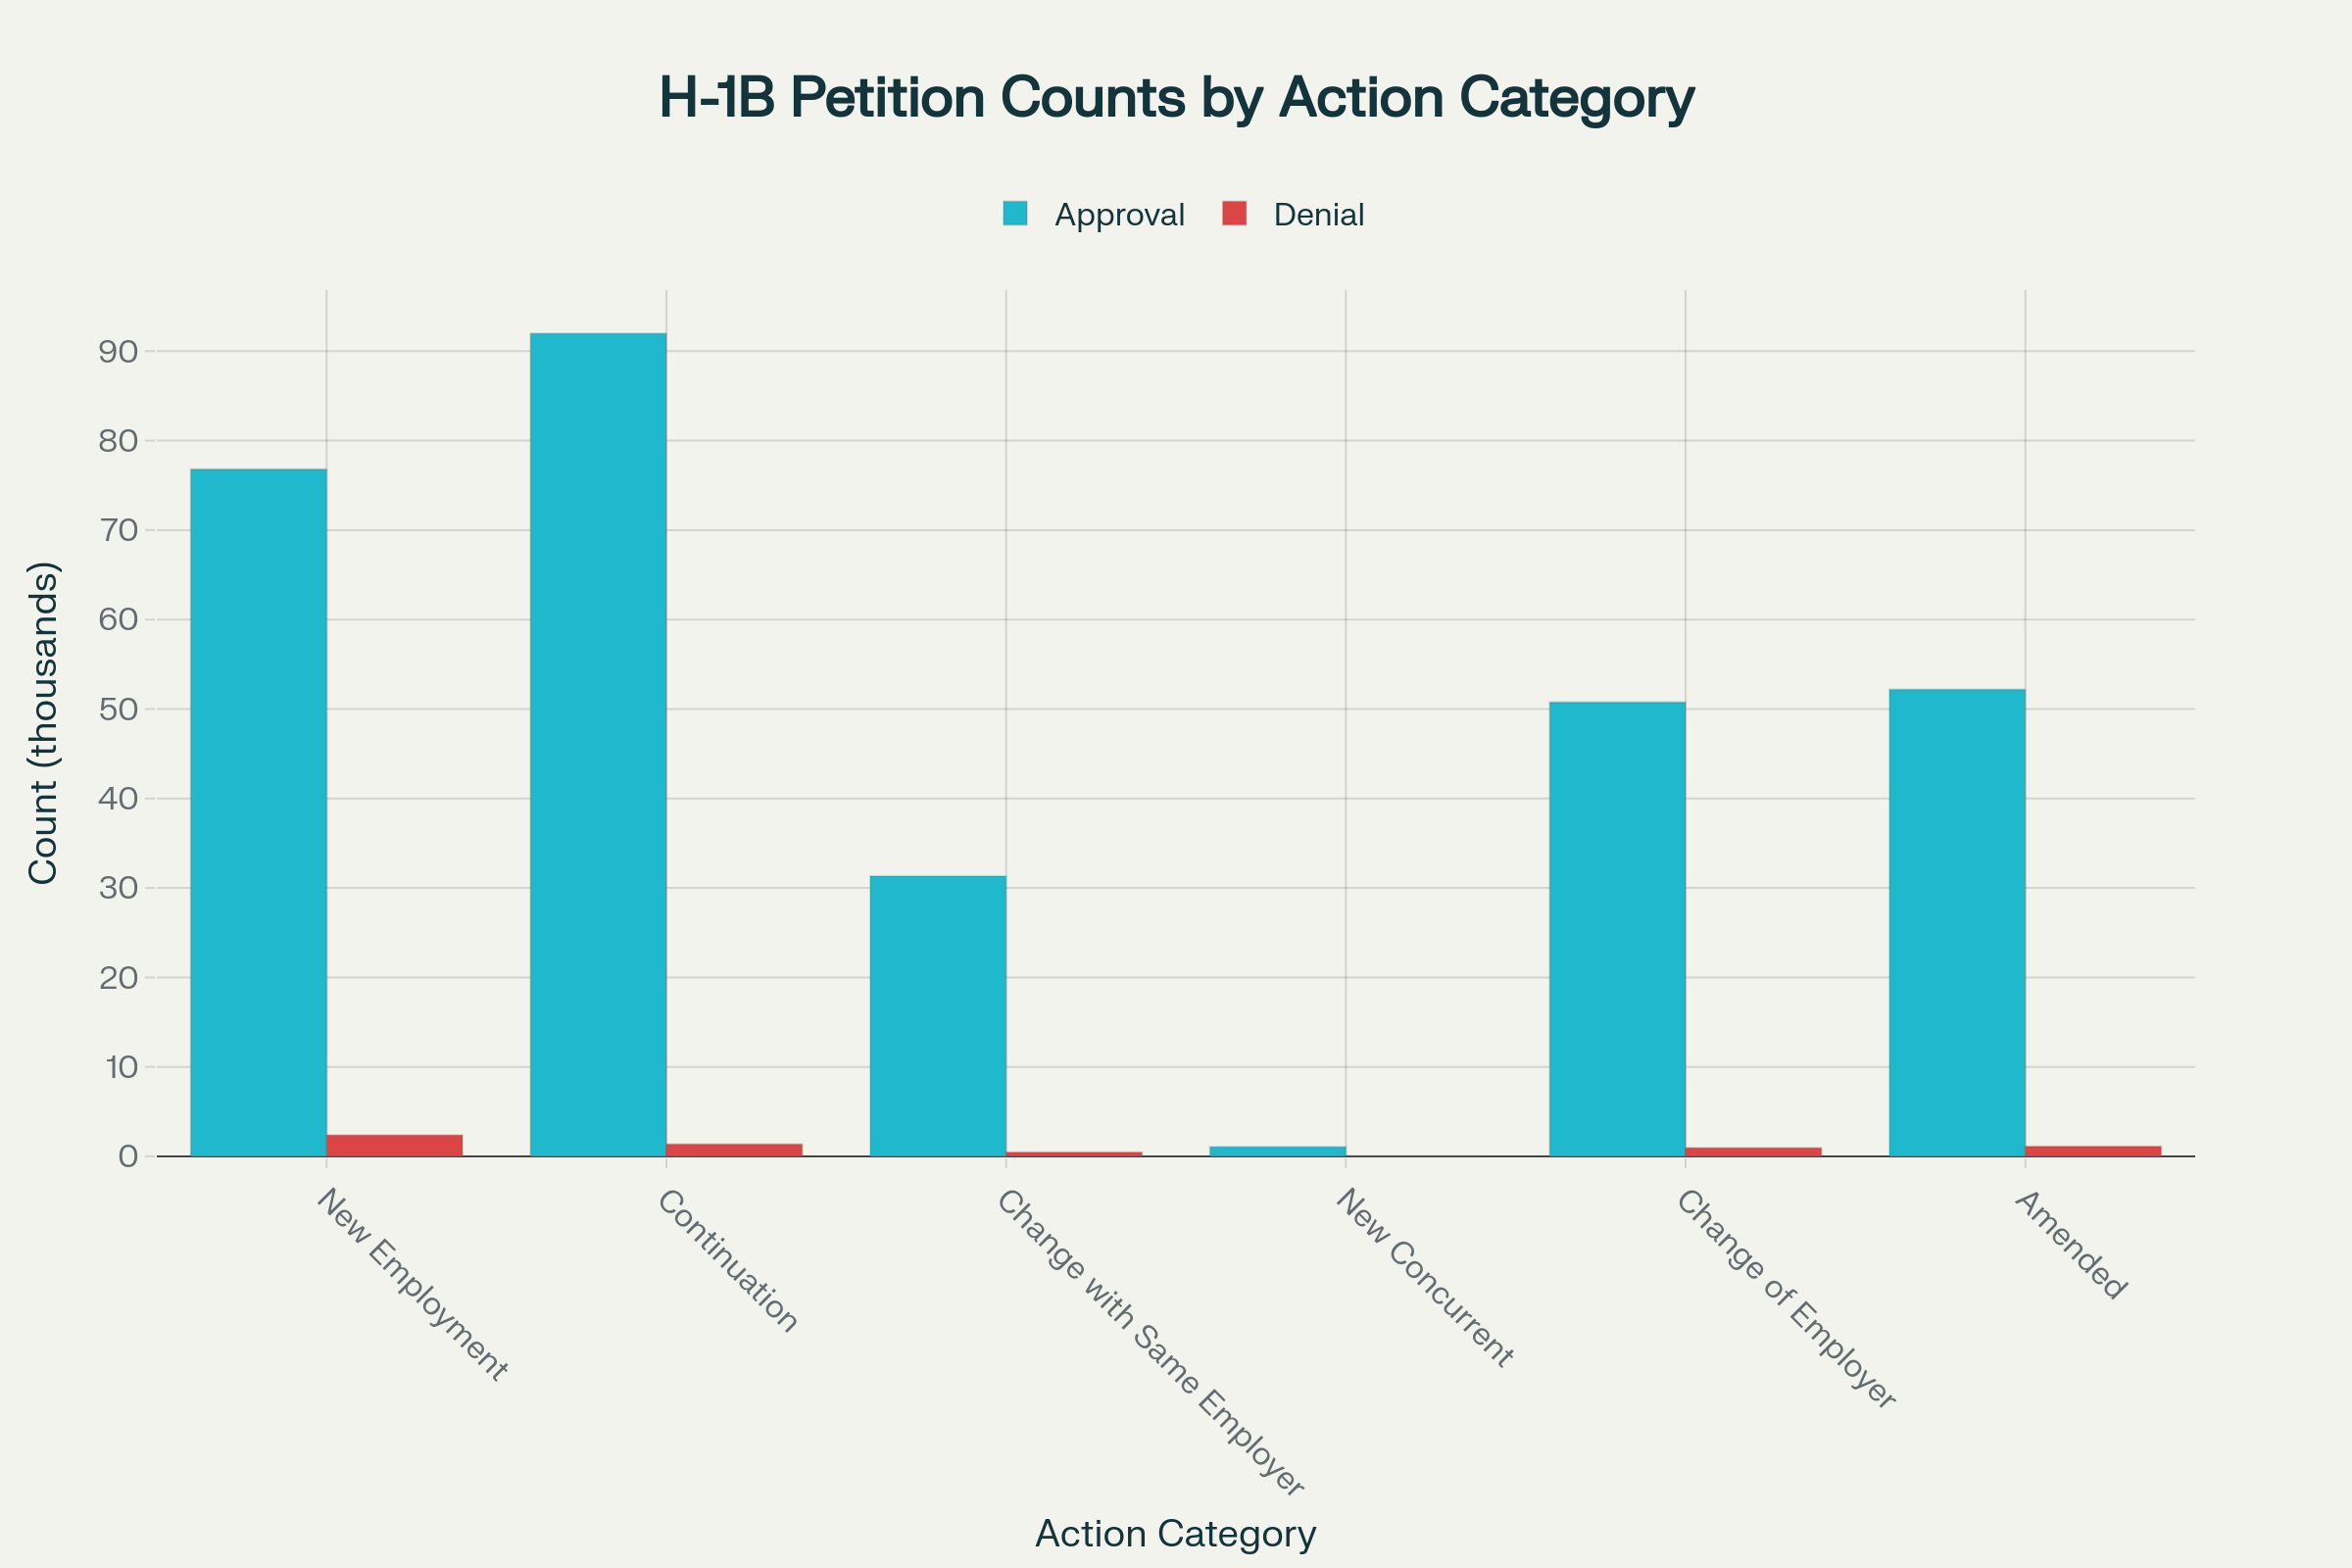
| Action Category | Glossary One-liner | Total Count | Status | Type |
|---|---|---|---|---|
| New Employment Approval | Initially approved H-1B petitions for new employment with a new employer | 76,812 | Approval | New Employment |
| New Employment Denial | Initially denied H-1B petitions for new employment with a new employer | 2,378 | Denial | New Employment |
| Continuation Approval | Approved H-1B petitions for continuing the same job with the same employer | 91,982 | Approval | Continuation |
| Continuation Denial | Denied H-1B petitions for continuing the same job with the same employer | 1,378 | Denial | Continuation |
| Change with Same Employer Approval | Approved H-1B petitions for non-material job changes with the same employer | 31,318 | Approval | Job Change (Same Employer) |
| Change with Same Employer Denial | Denied H-1B petitions for non-material job changes with the same employer | 459 | Denial | Job Change (Same Employer) |
| New Concurrent Approval | Approved H-1B petitions for additional employment while keeping current job | 1,067 | Approval | Concurrent Employment |
| New Concurrent Denial | Denied H-1B petitions for additional employment while keeping current job | 58 | Denial | Concurrent Employment |
| Change of Employer Approval | Approved H-1B petitions for switching to a new employer in same classification | 50,765 | Approval | Change of Employer |
| Change of Employer Denial | Denied H-1B petitions for switching to a new employer in same classification | 955 | Denial | Change of Employer |
| Amended Approval | Approved H-1B petitions for material changes to employment terms or conditions | 52,180 | Approval | Amended Employment |
| Amended Denial | Denied H-1B petitions for material changes to employment terms or conditions | 1,110 | Denial | Amended Employment |
Performing Data Analysis
1. Top Employers by H-1B Approvals in 2025
This identifies companies with the most new H-1B employment approvals recently, highlighting major players shaping the H-1B landscape amid changes in regulation and fees.
SELECT TOP 10
[Employer (Petitioner) Name], SUM([New Employment Approval]) AS Approvals
FROM [dbo].['Employer Information']
WHERE [Fiscal Year] = 2025
GROUP BY [Employer (Petitioner) Name]
ORDER BY Approvals DESC;
| Employer (Petitioner) Name | Approvals |
|---|---|
| AMAZON COM SERVICES LLC | 1706 |
| META PLATFORMS INC | 1360 |
| MICROSOFT CORPORATION | 1090 |
| TATA CONSULTANCY SERVICES LIMITED | 747 |
| GOOGLE LLC | 625 |
| APPLE INC | 603 |
| AMAZON DEVELOPMENT CENTER U S INC | 536 |
| NVIDIA CORPORATION | 512 |
| ERNST AND YOUNG U S LLP | 492 |
| INTEL CORPORATION | 487 |
2. Trending Industries (NAICS) by Number of Petitions Approved
Shows which sectors are leading in hiring foreign workers, highlighting macroeconomic shifts (e.g., surges in tech, healthcare, or engineering).
SELECT TOP 10
[Industry (NAICS) Code],
SUM([New Employment Approval] + [Continuation Approval] + [Change with Same Employer Approval] + [New Concurrent Approval] + [Change of Employer Approval] + [Amended Approval]) AS Total_Approvals
FROM [dbo].['Employer Information']
WHERE [Fiscal Year] >= 2025
GROUP BY [Industry (NAICS) Code]
ORDER BY Total_Approvals DESC;
| Industry (NAICS) Code | Total_Approvals |
|---|---|
| 54 - Professional, Scientific, and Technical Services | 129007 |
| 31-33 - Manufacturing | 33998 |
| 51 - Information | 33225 |
| 52 - Finance and Insurance | 28577 |
| 61 - Educational Services | 21775 |
| 44-45 - Retail Trade | 18372 |
| 62 - Health Care and Social Assistance | 13897 |
| Not Available | 5704 |
| 56 - Administrative and Support and Waste Management and Remediation Services | 3552 |
| 42 - Wholesale Trade | 3261 |
3. Geographic Trends: Top States by New Employment Approvals
Reveals which U.S. states have seen the strongest demand for H-1B talent in 2025, useful for understanding regional labor market shifts.
SELECT TOP 5
[Petitioner State], SUM([New Employment Approval]) AS Approvals
FROM [dbo].['Employer Information']
WHERE [Fiscal Year] = 2025
GROUP BY [Petitioner State]
ORDER BY Approvals DESC;
| Petitioner State | Approvals |
|---|---|
| CA | 13555 |
| Not Available | 8187 |
| TX | 7212 |
| NY | 7165 |
| NJ | 4651 |
4. Denial Rates by Employer for Problem Statement Analysis
Flags employers with unusually high denial rates, revealing compliance challenges or shifting standards.
SELECT TOP 10
       [Employer (Petitioner) Name],
       SUM([New Employment Approval]) AS approvals,
       SUM([New Employment Denial]) AS denials,
       ROUND(SUM([New Employment Denial]) * 100.0 / NULLIF(SUM([New Employment Approval]) + SUM([New Employment Denial]), 0), 2) AS Denial_Rate_PCT
FROM [dbo].['Employer Information']
WHERE [Fiscal Year] = 2025
GROUP BY [Employer (Petitioner) Name]
HAVING SUM([New Employment Denial]) > 5
ORDER BY Denial_Rate_PCT DESC;
| Employer (Petitioner) Name | approvals | denials | Denial_Rate_PCT |
|---|---|---|---|
| NK TECHNOLABS LLC | 0 | 10 | 100 |
| SAINT THERESA NURSELINKS INC | 1 | 12 | 92.31 |
| INTERNATIONAL QUALITY HOMECARE CORPORATION | 32 | 35 | 52.24 |
| NETSOLUTION CONSULT INC | 7 | 7 | 50 |
| FORTHRIGHT SOFT INC | 22 | 17 | 43.59 |
| ABN TECH CORPORATION | 13 | 8 | 38.1 |
| PEACHES AND PLATINUM LLC | 41 | 17 | 29.31 |
| NK TECHNOLABS, LLC | 18 | 6 | 25 |
| CUMBERLAND COUNTY HOSPITAL SYSTEM | 28 | 6 | 17.65 |
| EDU INFOTECH INTERNATIONAL RESOURCES INC. | 42 | 7 | 14.29 |
5. Industry Problem Patterns: High Denials by NAICS
Tracks which industries face most new denials, helping spotlight regulatory and sector-specific bottlenecks.
SELECT TOP 10
       [Industry (NAICS) Code],
       SUM([New Employment Denial]) AS Total_Denials
FROM [dbo].['Employer Information']
WHERE [Fiscal Year] >= 2025
GROUP BY [Industry (NAICS) Code]
ORDER BY Total_Denials DESC;
| Industry (NAICS) Code | Total_Denials |
|---|---|
| 54 - Professional, Scientific, and Technical Services | 1380 |
| 62 - Health Care and Social Assistance | 197 |
| 61 - Educational Services | 171 |
| 31-33 - Manufacturing | 119 |
| 44-45 - Retail Trade | 73 |
| 51 - Information | 66 |
| Not Available | 65 |
| 52 - Finance and Insurance | 52 |
| 56 - Administrative and Support and Waste Management and Remediation Services | 48 |
| 81 - Other Services (except Public Administration) | 46 |
6. ZIP Code Hotspots for New Employment Approvals
Maps local concentrations of approved petitions, revealing potential labor market hotspots or changes post-policy.
SELECT TOP 10
	[Petitioner Zip Code],
	SUM([New Employment Approval]) AS Approvals
FROM [dbo].['Employer Information']
WHERE [Fiscal Year] = 2025
GROUP BY [Petitioner Zip Code]
ORDER BY Approvals DESC;
| Petitioner Zip Code | Approvals |
|---|---|
| Not Available | 8187 |
| 22202 | 2723 |
| 94025 | 1457 |
| 98052 | 1166 |
| 95054 | 1084 |
| 94043 | 865 |
| 20850 | 776 |
| 95110 | 743 |
| 77845 | 637 |
| 10282 | 633 |
7. Change of Employer Patterns
Measures mobility among H-1B holders, useful for tracking effects of regulation or economic events like layoffs.
SELECT TOP 10
	[Employer (Petitioner) Name],
	SUM([Change with Same Employer Approval]) AS Change_Employer_Approvals
FROM [dbo].['Employer Information']
WHERE [Fiscal Year] = 2025
GROUP BY [Employer (Petitioner) Name]
ORDER BY Change_Employer_Approvals DESC;
| Employer (Petitioner) Name | Change_Employer_Approvals |
|---|---|
| MICROSOFT CORPORATION | 2660 |
| META PLATFORMS INC | 1887 |
| APPLE INC | 1511 |
| AMAZON COM SERVICES LLC | 1055 |
| TATA CONSULTANCY SERVICES LIMITED | 788 |
| INFOSYS LIMITED | 670 |
| INTEL CORPORATION | 593 |
| QUALCOMM TECHNOLOGIES INC | 551 |
| FORD MOTOR COMPANY | 335 |
| CAPITAL ONE SERVICES LLC | 317 |
8. Distribution of Petitions Across City
Identifies urban hotspots for H-1B hiring, helping pinpoint cities attracting the most international talent.
SELECT TOP 10
	[Petitioner City],
	SUM([New Employment Approval]) AS Approvals
FROM [dbo].['Employer Information']
WHERE [Fiscal Year] = 2025
GROUP BY [Petitioner City]
ORDER BY Approvals DESC;
| Petitioner City | Approvals |
|---|---|
| Not Available | 8186 |
| NEW YORK | 4979 |
| ARLINGTON | 2827 |
| CHICAGO | 1897 |
| SANTA CLARA | 1635 |
| MENLO PARK | 1456 |
| SAN JOSE | 1442 |
| SAN FRANCISCO | 1312 |
| REDMOND | 1167 |
| BOSTON | 1159 |
9. Approvals vs. Denials by Major Employers
Compares top employers on their ratio of approvals to denials, revealing firms successfully navigating the process.
SELECT TOP 10
       [Employer (Petitioner) Name],
       SUM([New Employment Approval]) AS approvals,
       SUM([New Employment Denial]) AS denials
FROM [dbo].['Employer Information']
WHERE [Fiscal Year] = 2025
GROUP BY [Employer (Petitioner) Name]
ORDER BY approvals DESC;
| Employer (Petitioner) Name | approvals | denials |
|---|---|---|
| AMAZON COM SERVICES LLC | 1706 | 20 |
| META PLATFORMS INC | 1360 | 6 |
| MICROSOFT CORPORATION | 1090 | 3 |
| TATA CONSULTANCY SERVICES LIMITED | 747 | 16 |
| GOOGLE LLC | 625 | 2 |
| APPLE INC | 603 | 1 |
| AMAZON DEVELOPMENT CENTER U S INC | 536 | 0 |
| NVIDIA CORPORATION | 512 | 0 |
| ERNST AND YOUNG U S LLP | 492 | 0 |
| INTEL CORPORATION | 487 | 10 |
10. Most Active NAICS Sectors for Change of Employer
Tracks which sectors have the most H-1B workers switching jobs, indicative of market turbulence or talent poaching.
SELECT TOP 10
	[Industry (NAICS) Code],
	SUM([Change with Same Employer Approval]) AS Change_Employer_Approvals
FROM [dbo].['Employer Information']
WHERE [Fiscal Year] = 2025
GROUP BY [Industry (NAICS) Code]
ORDER BY change_employer_approvals DESC;
| Industry (NAICS) Code | Change_Employer_Approvals |
|---|---|
| 54 - Professional, Scientific, and Technical Services | 9106 |
| 51 - Information | 6828 |
| 31-33 - Manufacturing | 6052 |
| 52 - Finance and Insurance | 3797 |
| 44-45 - Retail Trade | 1937 |
| 61 - Educational Services | 1221 |
| 62 - Health Care and Social Assistance | 625 |
| Not Available | 309 |
| 42 - Wholesale Trade | 287 |
| 56 - Administrative and Support and Waste Management and Remediation Services | 220 |
11. Proportion of Amended Petitions by Employer
Shows which employers frequently amend existing petitions, perhaps reflecting role changes or compliance challenges.
SELECT TOP 10
	[Employer (Petitioner) Name],
	SUM([Amended Approval]) AS Amended_Approvals
FROM [dbo].['Employer Information']
WHERE [Fiscal Year] = 2025
GROUP BY [Employer (Petitioner) Name]
ORDER BY Amended_Approvals DESC;
| Employer (Petitioner) Name | Amended_Approvals |
|---|---|
| AMAZON COM SERVICES LLC | 2319 |
| TATA CONSULTANCY SERVICES LIMITED | 2102 |
| COGNIZANT TECHNOLOGY SOLUTIONS US CORP | 1461 |
| CAPGEMINI AMERICA INC | 1039 |
| ACCENTURE LLP | 1024 |
| LTIMINDTREE LIMITED | 977 |
| ERNST AND YOUNG U S LLP | 854 |
| HCL AMERICA INC | 828 |
| COGNIZANT TECHNOLOGY SOLUTIONS US | 786 |
| WIPRO LIMITED | 761 |
12. State-level Denial Rate Comparison
Compares denial rates by state to reveal regions with stricter application outcomes or compliance challenges.
SELECT [Petitioner State],
       SUM([New Employment Approval]) AS approvals,
       SUM([New Employment Denial]) AS denials,
       ROUND(SUM([New Employment Denial]) * 100.0 / NULLIF(SUM([New Employment Approval]) + SUM([New Employment Denial]), 0), 2) AS Denial_Rate_PCT
FROM [dbo].['Employer Information']
WHERE [Fiscal Year] = 2025
GROUP BY [Petitioner State]
ORDER BY Denial_Rate_PCT DESC;
| Petitioner State | approvals | denials | Denial_Rate_PCT |
|---|---|---|---|
| WY | 51 | 13 | 20.31 |
| VI | 7 | 1 | 12.5 |
| SC | 254 | 25 | 8.96 |
| MP | 15 | 1 | 6.25 |
| NV | 142 | 9 | 5.96 |
| DE | 307 | 17 | 5.25 |
| OR | 201 | 11 | 5.19 |
| Not Available | 8187 | 431 | 5 |
| GA | 1940 | 93 | 4.57 |
| TX | 7212 | 326 | 4.32 |
| NM | 244 | 11 | 4.31 |
| ND | 114 | 5 | 4.2 |
| OK | 195 | 8 | 3.94 |
| IA | 368 | 15 | 3.92 |
| MS | 102 | 4 | 3.77 |
| ME | 77 | 3 | 3.75 |
| OH | 1297 | 48 | 3.57 |
| FL | 2274 | 84 | 3.56 |
| NJ | 4651 | 167 | 3.47 |
| LA | 263 | 9 | 3.31 |
| KY | 175 | 6 | 3.31 |
| TN | 730 | 24 | 3.18 |
| MO | 720 | 23 | 3.1 |
| NC | 1769 | 54 | 2.96 |
| MN | 763 | 22 | 2.8 |
| DC | 313 | 9 | 2.8 |
| NH | 105 | 3 | 2.78 |
| AZ | 1057 | 30 | 2.76 |
| MD | 1676 | 47 | 2.73 |
| GU | 180 | 5 | 2.7 |
| KS | 289 | 8 | 2.69 |
| IL | 3237 | 86 | 2.59 |
| CT | 589 | 15 | 2.48 |
| NY | 7165 | 182 | 2.48 |
| AK | 83 | 2 | 2.35 |
| CO | 542 | 13 | 2.34 |
| VA | 4378 | 98 | 2.19 |
| PA | 1860 | 41 | 2.16 |
| MI | 1634 | 35 | 2.1 |
| IN | 565 | 12 | 2.08 |
| UT | 282 | 6 | 2.08 |
| AR | 436 | 9 | 2.02 |
| CA | 13555 | 268 | 1.94 |
| MT | 53 | 1 | 1.85 |
| VT | 58 | 1 | 1.69 |
| ID | 244 | 4 | 1.61 |
| WA | 1908 | 30 | 1.55 |
| MA | 2947 | 44 | 1.47 |
| WI | 469 | 7 | 1.47 |
| NE | 231 | 3 | 1.28 |
| RI | 322 | 4 | 1.23 |
| SD | 174 | 2 | 1.14 |
| AL | 267 | 3 | 1.11 |
| WV | 72 | 0 | 0 |
| HI | 44 | 0 | 0 |
| PR | 19 | 0 | 0 |
| AS | 0 | 0 | NULL |
| XX | 0 | 0 | NULL |
| AA | 0 | 0 | NULL |
13. Top Industries Requesting Continuation
Tracks sectors most reliant on extensions, giving insight into long-term dependency on foreign labor.
SELECT TOP 10
	[Industry (NAICS) Code],
	SUM([Continuation Approval]) AS Continuation_Approvals
FROM [dbo].['Employer Information']
WHERE [Fiscal Year] = 2025
GROUP BY [Industry (NAICS) Code]
ORDER BY Continuation_Approvals DESC;
| Industry (NAICS) Code | Continuation_Approvals |
|---|---|
| 54 - Professional, Scientific, and Technical Services | 32509 |
| 31-33 - Manufacturing | 11952 |
| 52 - Finance and Insurance | 10799 |
| 51 - Information | 9540 |
| 44-45 - Retail Trade | 6825 |
| 61 - Educational Services | 6748 |
| 62 - Health Care and Social Assistance | 4256 |
| 55 - Management of Companies and Enterprises | 1963 |
| Not Available | 1939 |
| 42 - Wholesale Trade | 1347 |
14. Employers with High Proportion of Denied Amended Petitions
Highlights employers frequently denied for amendments, indicating potential compliance or documentation issues.
SELECT TOP 10
	[Employer (Petitioner) Name],
	SUM([Amended Denial]) AS Denied_Amendments
FROM [dbo].['Employer Information']
WHERE [Fiscal Year] = 2025
GROUP BY [Employer (Petitioner) Name]
ORDER BY denied_amendments DESC;
| Employer (Petitioner) Name | Denied_Amendments |
|---|---|
| TATA CONSULTANCY SERVICES LIMITED | 181 |
| AMAZON COM SERVICES LLC | 45 |
| WIPRO LIMITED | 20 |
| THE DEVEREUX FOUNDATION | 19 |
| DELOITTE CONSULTING LLP | 17 |
| HCL AMERICA INC | 17 |
| IBM CORPORATION | 14 |
| CAPGEMINI AMERICA INC | 12 |
| KFORCE INC | 12 |
| VIRTUSA CORPORATION | 11 |
15. Major Employers' Use of Concurrent Approvals
Analyzes which employers frequently request concurrent employment, which can indicate flexible labor use or compliance tactics.
SELECT TOP 10
	[Employer (Petitioner) Name],
	SUM([New Concurrent Approval]) AS Concurrent_Approvals
FROM [dbo].['Employer Information']
WHERE [Fiscal Year] = 2025
GROUP BY [Employer (Petitioner) Name]
ORDER BY Concurrent_Approvals DESC;
| Employer (Petitioner) Name | Concurrent_Approvals |
|---|---|
| COMPUNNEL SOFTWARE GROUP INC | 23 |
| WEST VIRGINIA UNIVERSITY MEDICAL CORPORATION D B A UNIVERSITY HEALTH | 16 |
| WEST VIRGINIA UNIVERSITY | 13 |
| THE UNIVERSITY OF VERMONT | 10 |
| VIRGINIA COMMONWEALTH UNIVERSITY | 9 |
| THE DEPARTMENT OF MEDICINE MEDICAL | 8 |
| GOOGLE LLC | 7 |
| HCL GLOBAL SYSTEMS INC | 7 |
| THE UNIVERSITY OF KANSAS PHYSICIAN | 7 |
| UNIVERSITY OF ALABAMA AT BIRMINGHAM | 7 |
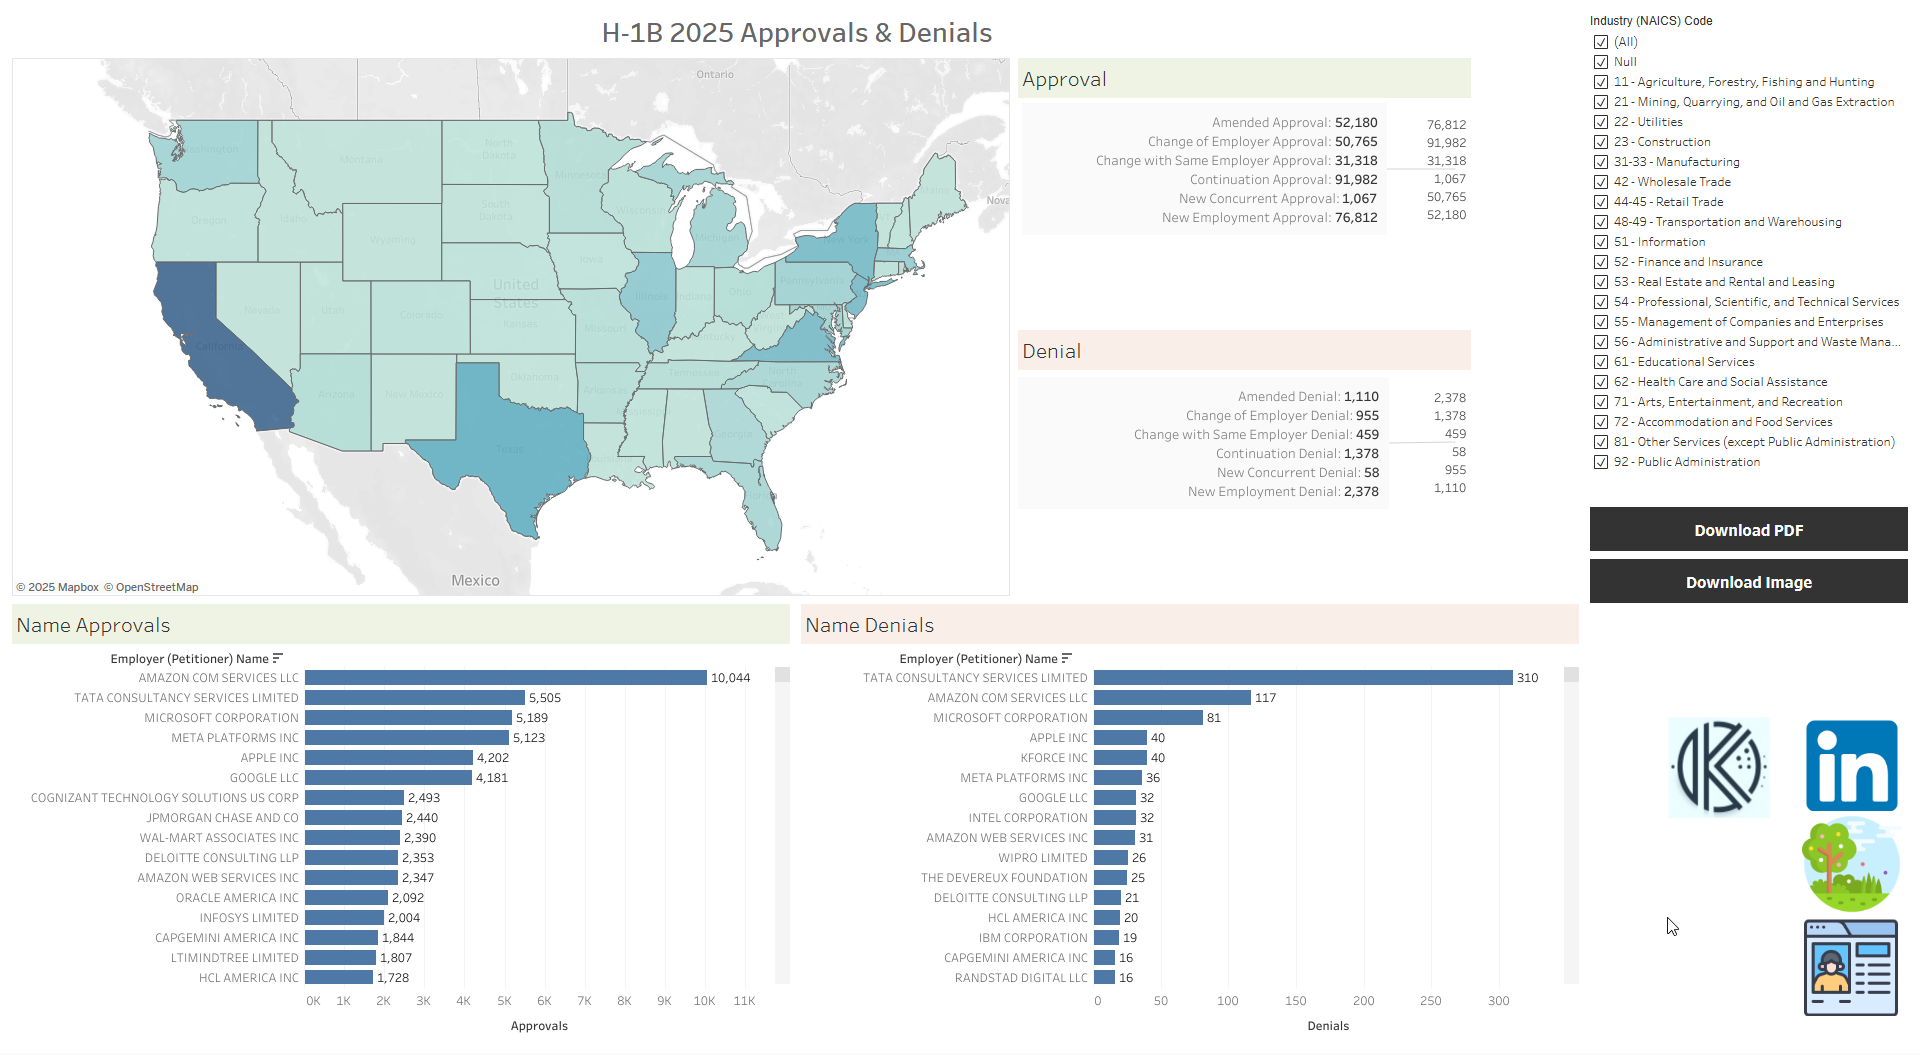
Data Visualization
- Visualization using Tableau Desktop Public Edition 2025.02.
- Preparation Work:
- Imported the Excel data file into Tableau.
- Created Calculated Fields for SUM of all Approvals, Denials.
- Updated > Maps > Edit Locations. (Country: United States; State: Petitioner State Columns)
- This will align and auto map, using Matching Location.
- General:
- Added Petitioner State to Marks - Details.
- Added SUM(Approval) to Marks - Color.
- Added Longitude and Latitude (generated) to Columns and Rows respectively.
- Added all the Measures to the Marks - Details, in the same order present in the Source.
- Approval:
- Added Industry NAICS Code column to the Pages filter.
- Added Industry Petitioner City column to the Pages filter.
- Added all the Approvals using this Mark - Text. Formatting:
Amended Approval: <SUM(Amended Approval)>
Change of Employer Approval: <SUM(Change of Employer Approval)>
Change with Same Employer Approval: <SUM(Change with Same Employer Approval)>
Continuation Approval: <SUM(Continuation Approval)>
New Concurrent Approval: <SUM(New Concurrent Approval)>
New Employment Approval: <SUM(New Employment Approval)>
- Denial:
- Added Industry NAICS Code column to the Pages filter.
- Added Industry Petitioner City column to the Pages filter.
- Added all the Denials using this Mark - Text. Formatting:
Amended Denial: <SUM(Amended Denial)>
Change of Employer Denial: <SUM(Change of Employer Denial)>
Change with Same Employer Denial: <SUM(Change with Same Employer Denial)>
Continuation Denial: <SUM(Continuation Denial)>
New Concurrent Denial: <SUM(New Concurrent Denial)>
New Employment Denial: <SUM(New Employment Denial)>
- Name Approvals:
- Added New Employment Approval to Rows.
- Added SUM(Approval) to Columns and Marks - Text.
- Name Denials
- Added New Employment Approval to Rows.
- Added SUM(Denial) to Columns and Marks - Text.
- Approvals & Denials:
- Organized the Worksheets into this dashboard.
- Added my custom logo, links to LinkedIn, Digital Garden, Online Resume.