H-1B Analysis - Historical
- Tableau - Link For H-1B 2025 Approvals and Denials
- GitHub - Data Files For H-1B 2025 Approvals and Denials
Why?
After seeing a lot of news about H-1B, and its impacts. I wanted to do a data analysis based on the openly available data source from the US GOV site. Still I was not able to get the data which I expected to see, which actually would answer my questions such as:
- Impact of $100,000 H-1B Application Fee
- US Government Shutdown Impact
- Mass Layoffs and H-1B Hiring
- Investigation Into H-1B Abuse
- Geographic & Wage Shifts
Currently I would like to proceed with the data that is available on the USCIS GOV site and later take it forward with the other questions as and when the data is procurable.
- In this page the historical data are covered (FY 2009-23).
Data Source:
- https://www.uscis.gov/archive/h-1b-employer-data-hub-files
- All the archives were downloaded (FY 2009-23).
- Files downloaded on October 6th, 2025.
Cleaning & Data Preparation
- Downloaded all the Archive historic data hub file.
- Started using the already created database in SSMS -
[H-1B Analysis].
CREATE DATABASE [H-1B Analysis];
- First created and loaded 2009 File into table
[dbo].[H1B_DataHubExport]using the SQL Server Import and Export Wizard.- Parameters:
- Data Source: Flat File Source,
- Format: Delimited,
- Text Qualifier:
" - Header row delimiter: Comma
- Header rows to skip:
0 - Check: Column names in first data row
- Parameters:
- Then the remaining 14 files, till 2023 were also loaded into the table
H1B_DataHubExportfor consolidated approach.- 2009 - 68919 rows transferred
- 2010 - 55429 rows transferred
- 2011 - 62874 rows transferred
- 2012 - 56222 rows transferred
- 2013 - 56079 rows transferred
- 2014 - 56595 rows transferred
- 2015 - 48544 rows transferred
- 2016 - 53129 rows transferred
- 2017 - 49786 rows transferred
- 2018 - 55666 rows transferred
- 2019 - 59441 rows transferred
- 2020 - 55239 rows transferred
- 2021 - 60806 rows transferred
- 2022 - 59983 rows transferred
- 2023 - 33332 rows transferred
- 2020, 2021, 2022, 2023 files were imported separately due to some column length and characteristic issues. Imported by Flat File Import instead of the Import and Export Wizard.
- Also confirmed the above transferred records using the below code.
SELECT [Fiscal Year], COUNT(*) COUNTALL
FROM [dbo].[H1B_DataHubExport_Final]
GROUP BY [Fiscal Year]
ORDER BY 1;
Additional Steps in Data Prep:
- Increasing the column size of the
[Employer]
ALTER TABLE [dbo].[H1B_DataHubExport]
ALTER COLUMN [Employer] NVARCHAR(255);
- It did not fix the problem, hence increased it to MAX.
ALTER TABLE [dbo].[H1B_DataHubExport]
ALTER COLUMN [Employer] [varchar](max) NULL;
- Also updated the
[Fiscal Year]
ALTER TABLE [dbo].[H1B_DataHubExport]
ALTER COLUMN [Fiscal Year] [smallint] NULL;
- Converting varchar to float
[Initial Approvals]
UPDATE [dbo].[H1B_DataHubExport]
SET [Initial Approvals] = REPLACE([Initial Approvals],',','');
---
ALTER TABLE [dbo].[H1B_DataHubExport]
ALTER COLUMN [Initial Approvals] [float] NULL;
- Converting varchar to float
[Initial Denials]
UPDATE [dbo].[H1B_DataHubExport]
SET [Initial Denials] = REPLACE([Initial Denials],',','');
---
ALTER TABLE [dbo].[H1B_DataHubExport]
ALTER COLUMN [Initial Denials] [float] NULL;
- Converting varchar to float
[Continuing Approvals]
UPDATE [dbo].[H1B_DataHubExport]
SET [Continuing Approvals] = REPLACE([Continuing Approvals],',','');
---
ALTER TABLE [dbo].[H1B_DataHubExport]
ALTER COLUMN [Continuing Approvals] [float] NULL;
- Converting varchar to float
[Continuing Denials]
UPDATE [dbo].[H1B_DataHubExport]
SET [Continuing Denials] = REPLACE([Continuing Denials],',','');
---
ALTER TABLE [dbo].[H1B_DataHubExport]
ALTER COLUMN [Continuing Denials] [float] NULL;
- Converting varchar to tinyint
[NAICS]
ALTER TABLE [dbo].[H1B_DataHubExport]
ALTER COLUMN [NAICS] [tinyint] NULL;
- Converting varchar to nvarchar 50
[State]
ALTER TABLE [dbo].[H1B_DataHubExport]
ALTER COLUMN [State] [nvarchar](50) NULL;
- Converting varchar to nvarchar 50
[City]
ALTER TABLE [dbo].[H1B_DataHubExport]
ALTER COLUMN [City] [nvarchar](50) NULL;
- Converting varchar to nvarchar 50
[City]
ALTER TABLE [dbo].[H1B_DataHubExport]
ALTER COLUMN [ZIP] [int] NULL;
- Converting varchar to nvarchar 50
[Tax_ID]
ALTER TABLE [dbo].[H1B_DataHubExport_Final]
ALTER COLUMN [Tax_ID] [smallint] NULL;
- To check which are causing the issue in varchar to float
SELECT DISTINCT TRY_CAST([Initial Denials] AS FLOAT) FROM [dbo].[H1B_DataHubExport];

SELECT DISTINCT CAST(ISNULL(NULLIF(TRIM([Initial Denials]), ''), '0') AS FLOAT) FROM [dbo].[H1B_DataHubExport];

SELECT *
FROM [dbo].[H1B_DataHubExport]
WHERE TRY_CAST([Continuing Approvals] AS FLOAT) IS NULL
      AND [Continuing Approvals] IS NOT NULL
      AND LTRIM(RTRIM([Continuing Approvals])) <> '';
- Checking if all the data are inline for next steps
SELECT * FROM [dbo].[H1B_DataHubExport]
UNION ALL
SELECT * FROM [dbo].[h1b_datahubexport-2020]
UNION ALL
SELECT * FROM [dbo].[h1b_datahubexport-2021]
UNION ALL
SELECT * FROM [dbo].[h1b_datahubexport-2022]
UNION ALL
SELECT * FROM [dbo].[h1b_datahubexport-2023]; -- 832044
- Combing all the data into a single table
CREATE TABLE [dbo].[H1B_DataHubExport_Final](
	[Fiscal Year] [smallint] NULL,
	[Employer] [varchar](max) NULL,
	[Initial Approvals] [float] NULL,
	[Initial Denials] [float] NULL,
	[Continuing Approvals] [float] NULL,
	[Continuing Denials] [float] NULL,
	[NAICS] [tinyint] NULL,
	[Tax ID] [varchar](50) NULL,
	[State] [nvarchar](50) NULL,
	[City] [nvarchar](50) NULL,
	[ZIP] [int] NULL
);

INSERT INTO [dbo].[H1B_DataHubExport_Final]
SELECT * FROM [dbo].[H1B_DataHubExport]
UNION ALL
SELECT * FROM [dbo].[h1b_datahubexport-2020]
UNION ALL
SELECT * FROM [dbo].[h1b_datahubexport-2021]
UNION ALL
SELECT * FROM [dbo].[h1b_datahubexport-2022]
UNION ALL
SELECT * FROM [dbo].[h1b_datahubexport-2023];
-- (832044 rows affected)
- Checking if all the data is correctly loaded using count validation.
SELECT [Fiscal Year], COUNT(*) COUNTALL
FROM [dbo].[H1B_DataHubExport_Final]
GROUP BY [Fiscal Year]
ORDER BY 1;
| Fiscal Year | COUNTALL |
|---|---|
| 2009 | 68919 |
| 2010 | 55429 |
| 2011 | 62874 |
| 2012 | 56222 |
| 2013 | 56079 |
| 2014 | 56595 |
| 2015 | 48544 |
| 2016 | 53129 |
| 2017 | 49786 |
| 2018 | 55666 |
| 2019 | 59441 |
| 2020 | 55239 |
| 2021 | 60806 |
| 2022 | 59983 |
| 2023 | 33332 |
Exploring the Data
[Employer]
- Upon taking a count of
[Employer]found only,3,46,135records.
SELECT DISTINCT [Employer]
FROM [dbo].[H1B_DataHubExport_Final];
---
SELECT COUNT(DISTINCT[Employer]) AS [Employer Count]
FROM [dbo].[H1B_DataHubExport_Final]; -- 346135
- Wanted to sort the count in a descending order.
SELECT [Employer], COUNT(*) AS [Employer Count]
FROM [dbo].[H1B_DataHubExport_Final]
GROUP BY [Employer]
ORDER BY 2 DESC;
- Also wanted to check the top 10
[Employer]
SELECT TOP 10
[Employer], COUNT(*) AS [Count]
FROM [dbo].[H1B_DataHubExport_Final]
GROUP BY [Employer]
ORDER BY 2 DESC;
| Employer | Count |
|---|---|
| FIDELITY INVESTMENTS | 242 |
| TATA CONSULTANCY SVCS LTD | 192 |
| ACCENTURE LLP | 191 |
| DELOITTE CONSULTING LLP | 183 |
| CAPGEMINI AMERICA INC | 180 |
| WIPRO LIMITED | 179 |
| INFOSYS LIMITED | 177 |
| Not Available | 172 |
| ORACLE AMERICA INC | 150 |
| INTEL CORPORATION | 144 |
[NAICS]
- Upon taking a count of
[NAICS]found only,25records.
SELECT DISTINCT [NAICS]
FROM [dbo].[H1B_DataHubExport_Final];
---
SELECT COUNT(DISTINCT[NAICS]) AS [NAICS Count]
FROM [dbo].[H1B_DataHubExport_Final]; -- 25
- Wanted to sort the count in a descending order.
SELECT [NAICS], COUNT(*) AS [NAICS Count]
FROM [dbo].[H1B_DataHubExport_Final]
GROUP BY [NAICS]
ORDER BY 2 DESC;
- Also wanted to check the top 5
[NAICS]
SELECT TOP 5
[NAICS], COUNT(*) AS [Count]
FROM [dbo].[H1B_DataHubExport_Final]
GROUP BY [NAICS]
ORDER BY 2 DESC;
| NAICS | Count |
|---|---|
| 54 | 340016 |
| 62 | 78182 |
| 33 | 67826 |
| 61 | 50968 |
| 52 | 50451 |
[City], [State], [Zip]
- Upon taking a count of
[City], [State], [Zip]found only,24301records.
SELECT DISTINCT [City], [State], [ZIP]
FROM [dbo].[H1B_DataHubExport_Final]
ORDER BY 2,1; -- 24301
---
SELECT COUNT(*) AS COUNT FROM (
SELECT DISTINCT [City], [State], [ZIP]
FROM [dbo].[H1B_DataHubExport_Final]
) A; -- 24301
[City], [State]
- Upon taking a count of
[City], [State]found only,12841records.
SELECT DISTINCT [City], [State]
FROM [dbo].[H1B_DataHubExport_Final]
ORDER BY 2,1; -- 12841
---
SELECT COUNT(*) AS COUNT FROM (
SELECT DISTINCT [City], [State]
FROM [dbo].[H1B_DataHubExport_Final]
) A; -- 12841
- Wanted to sort the count in a descending order.
SELECT [City], [State], COUNT(*) AS [Count]
FROM [dbo].[H1B_DataHubExport_Final]
GROUP BY [City], [State]
ORDER BY 3 DESC;
- Also wanted to check the top 10
[City], [State]
SELECT TOP 10
[City], [State], COUNT(*) AS [Count]
FROM [dbo].[H1B_DataHubExport_Final]
GROUP BY [City], [State]
ORDER BY 3 DESC;
| City | State | Count |
|---|---|---|
| NEW YORK | NY | 64145 |
| HOUSTON | TX | 20628 |
| SAN FRANCISCO | CA | 19346 |
| CHICAGO | IL | 15114 |
| LOS ANGELES | CA | 13545 |
| MIAMI | FL | 11149 |
| BOSTON | MA | 10805 |
| DALLAS | TX | 9972 |
| ATLANTA | GA | 9085 |
| SAN JOSE | CA | 8711 |
[State]
- Upon taking a count of
[State]found only,62records.
SELECT DISTINCT [State]
FROM [dbo].[H1B_DataHubExport_Final]
ORDER BY 1; -- 62
---
SELECT COUNT(*) AS COUNT FROM (
SELECT DISTINCT [State]
FROM [dbo].[H1B_DataHubExport_Final]
) A; -- 62
- Wanted to sort the count in a descending order.
SELECT [State], COUNT(*) AS [Count]
FROM [dbo].[H1B_DataHubExport_Final]
GROUP BY [State]
ORDER BY 2 DESC;
- Also wanted to check the top 10
[State]
SELECT TOP 10
[Petitioner State], COUNT(*) AS [Count]
FROM [dbo].['Employer Information']
GROUP BY [Petitioner State]
ORDER BY 2 DESC;
| State | Count |
|---|---|
| CA | 160418 |
| NY | 101133 |
| TX | 75763 |
| NJ | 54665 |
| FL | 43250 |
| IL | 38503 |
| MA | 36941 |
| VA | 28356 |
| PA | 25941 |
| MI | 25751 |
Remaining Columns
SELECT SUM([Initial Approvals]) AS [Total Initial Approvals]
FROM [dbo].[H1B_DataHubExport_Final]; -- 1411508 > 1675596

SELECT SUM([Initial Denials]) AS [Total Initial Denials]
FROM [dbo].[H1B_DataHubExport_Final]; -- 164511 > 188454

SELECT SUM([Continuing Approvals]) AS [Total Continuing Approvals]
FROM [dbo].[H1B_DataHubExport_Final]; -- 2563437 > 3201196

SELECT SUM([Continuing Denials]) AS [Total Continuing Denials]
FROM [dbo].[H1B_DataHubExport_Final]; -- 142306 > 171745
| Action Category | Glossary One-liner | Total Count | Status | Type |
|---|---|---|---|---|
| New Employment Approval | Initially approved H-1B petitions for new employment with a new employer | 16,75,596 | Approval | New Employment |
| New Employment Denial | Initially denied H-1B petitions for new employment with a new employer | 1,88,454 | Denial | New Employment |
| Continuation Approval | Approved H-1B petitions for continuing the same job with the same employer | 32,01,196 | Approval | Continuation |
| Continuation Denial | Denied H-1B petitions for continuing the same job with the same employer | 1,71,745 | Denial | Continuation |
Performing Data Analysis
1. Total Initial Approvals Each Year
SELECT
[Fiscal Year],
SUM([Initial Approvals]) AS Total_Initial_Approvals
FROM [dbo].[H1B_DataHubExport_Final]
GROUP BY [Fiscal Year]
ORDER BY [Fiscal Year];
Shows the total number of initial H-1B approvals for each fiscal year.
| Fiscal Year | Total_Initial_Approvals |
|---|---|
| 2009 | 99790 |
| 2010 | 84038 |
| 2011 | 114863 |
| 2012 | 140809 |
| 2013 | 130736 |
| 2014 | 130616 |
| 2015 | 111846 |
| 2016 | 105092 |
| 2017 | 96166 |
| 2018 | 87889 |
| 2019 | 132967 |
| 2020 | 122894 |
| 2021 | 141194 |
| 2022 | 138381 |
| 2023 | 38315 |
2. Top 10 Employers by Initial Approvals (All Years)
SELECT TOP 10
[Employer],
SUM([Initial Approvals]) AS Total_Initial_Approvals
FROM [dbo].[H1B_DataHubExport_Final]
GROUP BY [Employer]
ORDER BY Total_Initial_Approvals DESC;
Finds companies with the highest initial H-1B approvals overall.
| Employer | Total_Initial_Approvals |
|---|---|
| WIPRO LIMITED | 28460 |
| TATA CONSULTANCY SERVICES LIMITED | 23485 |
| COGNIZANT TECH SOLNS US CORP | 22287 |
| ACCENTURE LLP | 21489 |
| TATA CONSULTANCY SVCS LTD | 20271 |
| INFOSYS TECHNOLOGIES LIMITED | 20078 |
| INFOSYS LIMITED | 20032 |
| MICROSOFT CORPORATION | 17416 |
| HCL AMERICA INC | 14052 |
| COGNIZANT TECH SOLUTIONS US CORP | 11966 |
3. Year-over-Year Growth/Decline in Initial Approvals
SELECT a.[Fiscal Year], a.Total_Initial_Approvals,
  a.Total_Initial_Approvals - b.Total_Initial_Approvals AS YoY_Change
FROM (
  SELECT [Fiscal Year], SUM([Initial Approvals]) AS Total_Initial_Approvals
  FROM [dbo].[H1B_DataHubExport_Final]
  GROUP BY [Fiscal Year]
) a
LEFT JOIN (
  SELECT [Fiscal Year], SUM([Initial Approvals]) AS Total_Initial_Approvals
  FROM [dbo].[H1B_DataHubExport_Final]
  GROUP BY [Fiscal Year]
) b
ON a.[Fiscal Year] = b.[Fiscal Year] + 1
ORDER BY a.[Fiscal Year];
Shows the year-over-year change in initial approvals.
| Fiscal Year | Total_Initial_Approvals | YoY_Change |
|---|---|---|
| 2009 | 99790 | NULL |
| 2010 | 84038 | -15752 |
| 2011 | 114863 | 30825 |
| 2012 | 140809 | 25946 |
| 2013 | 130736 | -10073 |
| 2014 | 130616 | -120 |
| 2015 | 111846 | -18770 |
| 2016 | 105092 | -6754 |
| 2017 | 96166 | -8926 |
| 2018 | 87889 | -8277 |
| 2019 | 132967 | 45078 |
| 2020 | 122894 | -10073 |
| 2021 | 141194 | 18300 |
| 2022 | 138381 | -2813 |
| 2023 | 38315 | -100066 |
4. Denial Rates by NAICS Industry
SELECT [NAICS],
  SUM([Initial Denials]) AS Total_Initial_Denials,
  SUM([Initial Approvals]) AS Total_Initial_Approvals,
  (CAST(SUM([Initial Denials]) AS FLOAT) / NULLIF(SUM([Initial Approvals]) + SUM([Initial Denials]), 0)) AS Initial_Denial_Rate
FROM [dbo].[H1B_DataHubExport_Final]
GROUP BY [NAICS]
ORDER BY Initial_Denial_Rate DESC;
Calculates initial denial rates by industry.
| NAICS | Total_Initial_Denials | Total_Initial_Approvals | Initial_Denial_Rate |
|---|---|---|---|
| 72 | 1765 | 4865 | 0.266214 |
| 99 | 4414 | 19238 | 0.186623 |
| 53 | 992 | 5056 | 0.164021 |
| 56 | 3286 | 17070 | 0.161427 |
| 44 | 1877 | 10515 | 0.151469 |
| 81 | 1383 | 7789 | 0.150785 |
| 11 | 255 | 1490 | 0.146132 |
| 71 | 757 | 4444 | 0.145549 |
| 54 | 140981 | 929462 | 0.131703 |
| 42 | 2062 | 13906 | 0.129133 |
| 48 | 753 | 5221 | 0.126046 |
| 31 | 881 | 7696 | 0.102717 |
| 92 | 327 | 3185 | 0.093109 |
| 49 | 124 | 1388 | 0.082011 |
| 23 | 680 | 8588 | 0.073371 |
| 62 | 7007 | 89386 | 0.072692 |
| 55 | 304 | 5591 | 0.051569 |
| 32 | 1018 | 21070 | 0.046088 |
| 52 | 3621 | 75767 | 0.045611 |
| 51 | 4114 | 86451 | 0.045426 |
| 22 | 145 | 3711 | 0.037604 |
| 33 | 4224 | 126611 | 0.032285 |
| 45 | 1371 | 41443 | 0.032022 |
| 61 | 5929 | 179679 | 0.031944 |
| 21 | 184 | 5974 | 0.02988 |
5. States with Highest H-1B Activity
SELECT TOP 10
	[State],
	SUM([Initial Approvals] + [Initial Denials] + [Continuing Approvals] + [Continuing Denials]) AS Total_Activity
FROM [dbo].[H1B_DataHubExport_Final]
GROUP BY [State]
ORDER BY Total_Activity DESC;
Ranks states by total H-1B petition activity. (Top 10)
| State | Total_Activity |
|---|---|
| CA | 941621 |
| TX | 693830 |
| NJ | 647114 |
| NY | 375984 |
| IL | 286316 |
| MA | 224848 |
| WA | 204469 |
| MD | 199730 |
| PA | 196599 |
| MI | 179696 |
6. Top Cities for H-1B Approvals
SELECT TOP 10
	[City],
	SUM([Initial Approvals] + [Continuing Approvals]) AS Total_Approvals
FROM [dbo].[H1B_DataHubExport_Final]
GROUP BY [City]
ORDER BY Total_Approvals DESC;
Shows cities with the most approvals across all years.
| City | Total_Approvals |
|---|---|
| NEW YORK | 252578 |
| CHICAGO | 155986 |
| COLLEGE STATION | 147293 |
| PLANO | 124360 |
| ROCKVILLE | 122565 |
| SAN FRANCISCO | 111072 |
| SEATTLE | 97208 |
| SAN JOSE | 93859 |
| EDISON | 80559 |
| EAST BRUNSWICK | 79315 |
7. Employer with Highest Denial Rate
SELECT TOP 10
  [Employer],
  SUM([Initial Denials]) AS Total_Denials,
  SUM([Initial Approvals]) AS Total_Approvals,
  (CAST(SUM([Initial Denials]) AS FLOAT) / NULLIF(SUM([Initial Denials]) + SUM([Initial Approvals]), 0)) AS Denial_Rate
FROM [dbo].[H1B_DataHubExport_Final]
GROUP BY [Employer]
HAVING SUM([Initial Denials]) + SUM([Initial Approvals]) > 50
ORDER BY Denial_Rate DESC;
Identifies employers with high initial denial rates among frequent filers.
| Employer | Total_Denials | Total_Approvals | Denial_Rate |
|---|---|---|---|
| AXIOM SOURCES LLC | 58 | 0 | 1 |
| SPLN LLC | 79 | 0 | 1 |
| CROCKETT TECHNICAL LLC | 87 | 1 | 0.988636 |
| KAASHYAP TECHNOLOGIES LIMITED INC | 67 | 3 | 0.957143 |
| INTERFACESYSTEMS INC | 62 | 3 | 0.953846 |
| MGT HEALTH SYSS LLC DBA MEDPRO | 72 | 4 | 0.947368 |
| MINDIQ SOLUTIONS INC | 54 | 3 | 0.947368 |
| RAYEX INC | 110 | 7 | 0.940171 |
| SUPREME SOFT INC | 73 | 5 | 0.935897 |
| TECHNO SOFT INC | 111 | 11 | 0.909836 |
8. Yearly Trends for Continuing Approvals
SELECT [Fiscal Year], SUM([Continuing Approvals]) AS Total_Continuing_Approvals
FROM [dbo].[H1B_DataHubExport_Final]
GROUP BY [Fiscal Year]
ORDER BY [Fiscal Year];
Tracks continuing approvals over time.
| Fiscal Year | Total_Continuing_Approvals |
|---|---|
| 2009 | 127687 |
| 2010 | 108935 |
| 2011 | 155186 |
| 2012 | 129023 |
| 2013 | 164538 |
| 2014 | 202190 |
| 2015 | 176656 |
| 2016 | 252120 |
| 2017 | 277229 |
| 2018 | 247072 |
| 2019 | 256356 |
| 2020 | 303830 |
| 2021 | 333929 |
| 2022 | 327810 |
| 2023 | 138635 |
9. Employers Operating in Multiple States
SELECT TOP 10
[Employer],
COUNT(DISTINCT [State]) AS State_Count
FROM [dbo].[H1B_DataHubExport_Final]
GROUP BY [Employer]
HAVING COUNT(DISTINCT [State]) > 1
ORDER BY State_Count DESC;
Finds employers with offices across several U.S. states.
| Employer | State_Count |
|---|---|
| Not Avaliable | 31 |
| URS CORPORATION | 19 |
| USDA AGRICULTURAL RESEARCH SVC | 18 |
| CIGNA HEALTH & LIFE INSURANCE CO | 17 |
| HONEYWELL INTERNATIONAL INC | 17 |
| WELLS FARGO BANK N A | 17 |
| EATON CORPORATION | 16 |
| WELLS FARGO BANK NA | 16 |
| MILLIMAN INC | 15 |
| TURNER CONSTRUCTION COMPANY | 15 |
10. ZIP Codes with Most H-1B Activity
SELECT TOP 10
[ZIP],
SUM([Initial Approvals] + [Continuing Approvals]) AS Total_Approvals
FROM [dbo].[H1B_DataHubExport_Final]
GROUP BY [ZIP]
ORDER BY Total_Approvals DESC;
Highlights ZIP codes with high approval counts.
| ZIP | Total_Approvals |
|---|---|
| 77845 | 144045 |
| 20850 | 117118 |
| 75024 | 112417 |
| 8816 | 81487 |
| 98052 | 68107 |
| 98121 | 62838 |
| 19103 | 61868 |
| 8817 | 58130 |
| 60601 | 55757 |
| 94043 | 52304 |
11. Average Approvals Per Employer
SELECT AVG(Total_Approvals) AS Avg_Approvals_Per_Employer
FROM (
  SELECT [Employer], SUM([Initial Approvals] + [Continuing Approvals]) AS Total_Approvals
  FROM [dbo].[H1B_DataHubExport_Final]
  GROUP BY [Employer]
) a;
Calculates the average number of approvals per employer across dataset.
14.0892366006425
12. NAICS Sectors with Highest H-1B Approvals
SELECT TOP 10
[NAICS],
SUM([Initial Approvals] + [Continuing Approvals]) AS Total_Approvals
FROM [dbo].[H1B_DataHubExport_Final]
GROUP BY [NAICS]
ORDER BY Total_Approvals DESC;
Shows industry sectors (by NAICS) most likely to employ H-1B workers.
| NAICS | Total_Approvals |
|---|---|
| 54 | 2695235 |
| 33 | 402404 |
| 61 | 368931 |
| 52 | 312964 |
| 51 | 311550 |
| 62 | 217306 |
| 45 | 135896 |
| 32 | 66002 |
| 56 | 45500 |
| 42 | 44179 |
13. Initial vs. Continuing Approval Trend Over Years
SELECT [Fiscal Year],
    SUM([Initial Approvals]) AS Initial_Approvals,
    SUM([Continuing Approvals]) AS Continuing_Approvals
FROM [dbo].[H1B_DataHubExport_Final]
GROUP BY [Fiscal Year]
ORDER BY [Fiscal Year];
Compares yearly trends between new and continuing approvals.
| Fiscal Year | Initial_Approvals | Continuing_Approvals |
|---|---|---|
| 2009 | 99790 | 127687 |
| 2010 | 84038 | 108935 |
| 2011 | 114863 | 155186 |
| 2012 | 140809 | 129023 |
| 2013 | 130736 | 164538 |
| 2014 | 130616 | 202190 |
| 2015 | 111846 | 176656 |
| 2016 | 105092 | 252120 |
| 2017 | 96166 | 277229 |
| 2018 | 87889 | 247072 |
| 2019 | 132967 | 256356 |
| 2020 | 122894 | 303830 |
| 2021 | 141194 | 333929 |
| 2022 | 138381 | 327810 |
| 2023 | 38315 | 138635 |
14. Top 10 Employers in Most Recent Year
SELECT TOP 10
[Employer],
SUM([Initial Approvals] + [Continuing Approvals]) AS Total_Approvals
FROM [dbo].[H1B_DataHubExport_Final]
WHERE
[Fiscal Year] =
(SELECT MAX([Fiscal Year]) FROM [dbo].[H1B_DataHubExport_Final])
GROUP BY [Employer]
ORDER BY Total_Approvals DESC;
Finds leading H-1B employers for the latest year available.
| Employer | Total_Approvals |
|---|---|
| AMAZON.COM SERVICES LLC | 4576 |
| COGNIZANT TECHNOLOGY SOLUTIONS US CORP | 3977 |
| TATA CONSULTANCY SVCS LTD | 3777 |
| INFOSYS LIMITED | 3449 |
| GOOGLE LLC | 2460 |
| MICROSOFT CORPORATION | 2066 |
| APPLE INC | 1825 |
| META PLATFORMS INC | 1537 |
| JPMORGAN CHASE CO | 1524 |
| DELOITTE CONSULTING LLP | 1487 |
15. Denial Rate Trend Over Years
SELECT [Fiscal Year],
  SUM([Initial Denials]) AS Denials,
  SUM([Initial Approvals]) AS Approvals,
  (CAST(SUM([Initial Denials]) AS FLOAT) / NULLIF(SUM([Initial Denials]) + SUM([Initial Approvals]),0)) AS Annual_Denial_Rate
FROM [dbo].[H1B_DataHubExport_Final]
GROUP BY [Fiscal Year]
ORDER BY [Fiscal Year];
Shows how the initial denial rate changes over time.
| Fiscal Year | Denials | Approvals | Annual_Denial_Rate |
|---|---|---|---|
| 2009 | 18099 | 99790 | 0.153526 |
| 2010 | 7352 | 84038 | 0.080446 |
| 2011 | 8583 | 114863 | 0.069528 |
| 2012 | 7401 | 140809 | 0.049936 |
| 2013 | 9596 | 130736 | 0.068381 |
| 2014 | 10645 | 130616 | 0.075357 |
| 2015 | 7644 | 111846 | 0.063972 |
| 2016 | 11295 | 105092 | 0.097047 |
| 2017 | 14518 | 96166 | 0.131166 |
| 2018 | 28181 | 87889 | 0.242793 |
| 2019 | 35633 | 132967 | 0.211346 |
| 2020 | 18276 | 122894 | 0.129461 |
| 2021 | 5667 | 141194 | 0.038588 |
| 2022 | 3132 | 138381 | 0.022132 |
| 2023 | 2432 | 38315 | 0.059685 |
16. Employers Filing in Only One NAICS Sector
SELECT [Employer], COUNT(DISTINCT [NAICS]) AS NAICS_Count
FROM [dbo].[H1B_DataHubExport_Final]
GROUP BY [Employer]
HAVING COUNT(DISTINCT [NAICS]) = 1
ORDER BY [Employer]
Lists companies that are only affiliated with a single NAICS/industry.
3,20,989 rows
Advance Data Analysis
1. Moving Average of Initial Approvals Over Years
SELECT
  [Fiscal Year],
  SUM([Initial Approvals]) AS Approvals,
  AVG(SUM([Initial Approvals])) OVER (
    ORDER BY [Fiscal Year]
    ROWS BETWEEN 2 PRECEDING AND CURRENT ROW
  ) AS Moving_Avg_Initial_Approvals
FROM [dbo].[H1B_DataHubExport_Final]
GROUP BY [Fiscal Year]
ORDER BY [Fiscal Year]
Calculates a 3-year moving average of initial approvals, smoothing year-to-year volatility.
| Fiscal Year | Approvals | Moving_Avg_Initial_Approvals |
|---|---|---|
| 2009 | 99790 | 99790 |
| 2010 | 84038 | 91914 |
| 2011 | 114863 | 99563.67 |
| 2012 | 140809 | 113236.7 |
| 2013 | 130736 | 128802.7 |
| 2014 | 130616 | 134053.7 |
| 2015 | 111846 | 124399.3 |
| 2016 | 105092 | 115851.3 |
| 2017 | 96166 | 104368 |
| 2018 | 87889 | 96382.33 |
| 2019 | 132967 | 105674 |
| 2020 | 122894 | 114583.3 |
| 2021 | 141194 | 132351.7 |
| 2022 | 138381 | 134156.3 |
| 2023 | 38315 | 105963.3 |
2. Top Employer Each Year (Correlated Subquery)
SELECT t.[Fiscal Year], t.[Employer], t.Total_Approvals
FROM (
  SELECT
    [Fiscal Year],
    [Employer],
    SUM([Initial Approvals] + [Continuing Approvals]) AS Total_Approvals
  FROM [dbo].[H1B_DataHubExport_Final]
  GROUP BY [Fiscal Year], [Employer]
) t
WHERE t.Total_Approvals = (
    SELECT TOP 1 SUM([Initial Approvals] + [Continuing Approvals])
    FROM [dbo].[H1B_DataHubExport_Final] t2
    WHERE t2.[Fiscal Year] = t.[Fiscal Year]
    GROUP BY t2.[Employer]
    ORDER BY SUM([Initial Approvals] + [Continuing Approvals]) DESC
)
ORDER BY t.[Fiscal Year];
Finds the single employer with the highest total approvals for every fiscal year.
| Fiscal Year | Employer | Total_Approvals |
|---|---|---|
| 2009 | WIPRO LIMITED | 3698 |
| 2010 | INFOSYS TECHNOLOGIES LIMITED | 7187 |
| 2011 | INFOSYS TECHNOLOGIES LIMITED | 9986 |
| 2012 | COGNIZANT TECH SOLNS US CORP | 15548 |
| 2013 | INFOSYS TECHNOLOGIES LIMITED | 12720 |
| 2014 | COGNIZANT TECH SOLUTIONS US CORP | 18649 |
| 2015 | COGNIZANT TECH SOLNS US CORP | 17028 |
| 2016 | COGNIZANT TECH SOLNS US CORP | 22515 |
| 2017 | COGNIZANT TECH SOLNS US CORP | 29408 |
| 2018 | COGNIZANT TECH SOLNS US CORP | 9263 |
| 2019 | COGNIZANT TECH SOLNS US CORP | 13366 |
| 2020 | COGNIZANT TECHNOLOGY SOLUTIONS US | 14754 |
| 2021 | INFOSYS LIMITED | 15426 |
| 2022 | AMAZON.COM SERVICES LLC | 13128 |
| 2023 | AMAZON.COM SERVICES LLC | 4576 |
3. Year-on-Year % Growth of Initial Approvals
WITH cte AS (
  SELECT
    [Fiscal Year],
    SUM([Initial Approvals]) AS Total_Initial_Approvals
  FROM [dbo].[H1B_DataHubExport_Final]
  GROUP BY [Fiscal Year]
)
SELECT
  [Fiscal Year],
  Total_Initial_Approvals,
  LAG(Total_Initial_Approvals, 1) OVER (ORDER BY [Fiscal Year]) AS Prev_Year_Approvals,
  CASE
    WHEN LAG(Total_Initial_Approvals, 1) OVER (ORDER BY [Fiscal Year]) > 0 THEN
      ROUND(
        100.0 * (Total_Initial_Approvals - LAG(Total_Initial_Approvals, 1) OVER (ORDER BY [Fiscal Year]))
        / LAG(Total_Initial_Approvals, 1) OVER (ORDER BY [Fiscal Year]),2)
    ELSE NULL END AS YoY_Percent_Change
FROM cte
ORDER BY [Fiscal Year];
Shows the annual percentage change in initial approvals.
| Fiscal Year | Total_Initial_Approvals | Prev_Year_Approvals | YoY_Percent_Change |
|---|---|---|---|
| 2009 | 99790 | NULL | NULL |
| 2010 | 84038 | 99790 | -15.79 |
| 2011 | 114863 | 84038 | 36.68 |
| 2012 | 140809 | 114863 | 22.59 |
| 2013 | 130736 | 140809 | -7.15 |
| 2014 | 130616 | 130736 | -0.09 |
| 2015 | 111846 | 130616 | -14.37 |
| 2016 | 105092 | 111846 | -6.04 |
| 2017 | 96166 | 105092 | -8.49 |
| 2018 | 87889 | 96166 | -8.61 |
| 2019 | 132967 | 87889 | 51.29 |
| 2020 | 122894 | 132967 | -7.58 |
| 2021 | 141194 | 122894 | 14.89 |
| 2022 | 138381 | 141194 | -1.99 |
| 2023 | 38315 | 138381 | -72.31 |
4. Share of Initial Denials by State (Window Function Partitioned by Year)
SELECT
  [Fiscal Year], [State],
  SUM([Initial Denials]) AS Denials,
  SUM([Initial Denials]) * 1.0 / SUM(SUM([Initial Denials])) OVER (PARTITION BY [Fiscal Year]) AS State_Denial_Share
FROM [dbo].[H1B_DataHubExport_Final]
GROUP BY [Fiscal Year], [State]
ORDER BY [Fiscal Year], State_Denial_Share DESC
Reveals what fraction of initial denials are contributed by each state for every year.
852 rows
5. Employers with an Increasing Trend in Approvals Over 3 Years
WITH EmployerYear AS (
  SELECT
    [Employer],
    [Fiscal Year],
    SUM([Initial Approvals] + [Continuing Approvals]) AS Total_Approvals
  FROM [dbo].[H1B_DataHubExport_Final]
  GROUP BY [Employer], [Fiscal Year]
)
SELECT e1.[Employer], e1.[Fiscal Year], e1.Total_Approvals
FROM EmployerYear e1
JOIN EmployerYear e2 ON e1.[Employer] = e2.[Employer] AND e1.[Fiscal Year] = e2.[Fiscal Year] + 1
JOIN EmployerYear e3 ON e1.[Employer] = e3.[Employer] AND e1.[Fiscal Year] = e3.[Fiscal Year] + 2
WHERE e1.Total_Approvals > e2.Total_Approvals
  AND e2.Total_Approvals > e3.Total_Approvals
ORDER BY e1.[Employer], e1.[Fiscal Year]
Finds employers whose approval counts have increased for three consecutive years.
18,773 rows - Employers
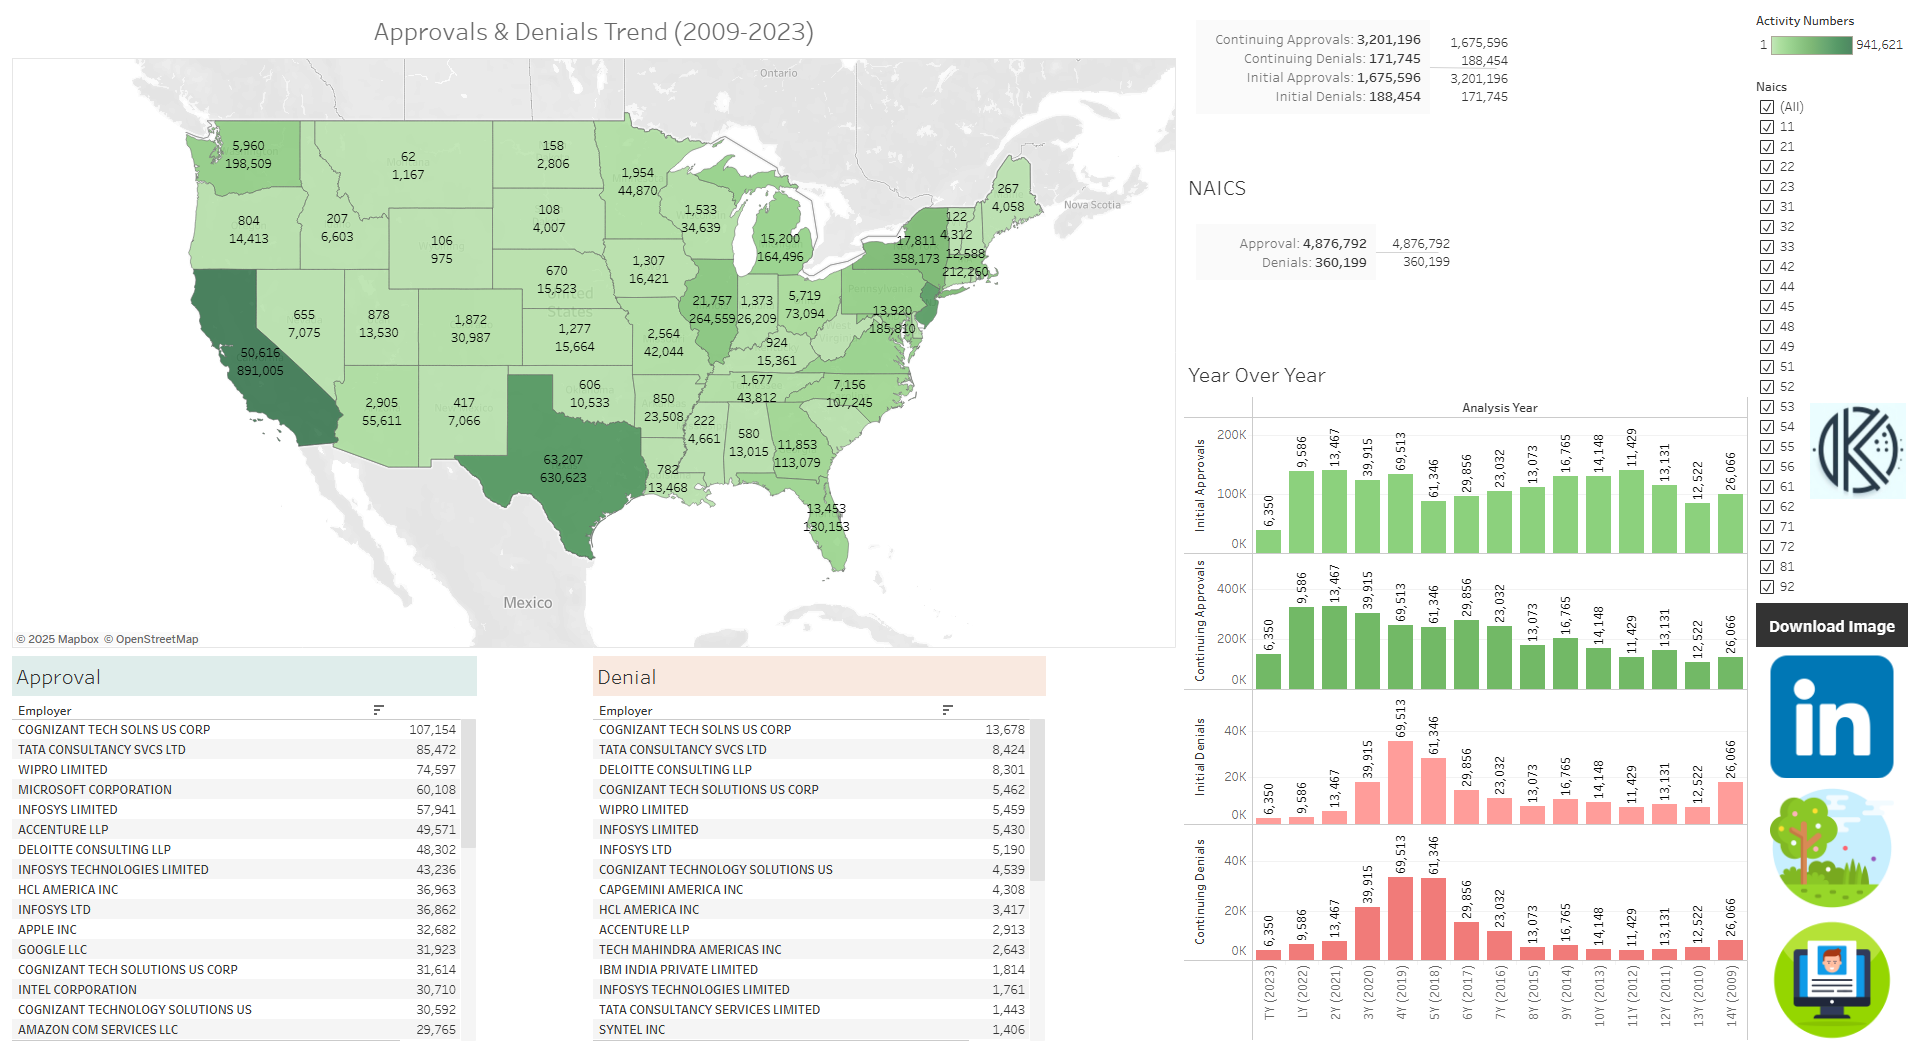
Data Visualization
- Currently, there are round
832044row in the consolidated file. It will be difficult to handle such a big file.
SELECT COUNT(*) COUTNALL FROM [dbo].[H1B_DataHubExport_Final];
- Lets do an aggregation to reduce the count.
- We can remove ZIP to reduce the count much further.
SELECT
[Fiscal Year],
[Employer],
SUM([Initial Approvals]),
SUM([Initial Denials]),
SUM([Continuing Approvals]),
SUM([Continuing Denials]),
[NAICS],
[Tax ID],
[State],
[City],
[ZIP]
FROM [dbo].[H1B_DataHubExport_Final]
GROUP BY
[Fiscal Year],
[Employer],
[NAICS],
[Tax ID],
[State],
[City],
[ZIP];
-
Counts
- Without Aggregations: 8,32,044
- Aggregations With ZIP: 8,18,210
- Aggregation Without ZIP: 8,05,401 ✅
- Proceeding with this result set.
-
Extracting the data into CSV format to be used in Tableau.
-
Visualization using Tableau Desktop Public Edition 2025.02.
-
Preparation Work:
- Imported the Excel data file into Tableau.
- Created Calculated Fields for SUM of all Approvals, Denials.
- Updated > Maps > Edit Locations. (Country: United States; State: Petitioner State Columns)
- This will align and auto map, using Matching Location.
-
Activity:
- Added State to Marks - Details.
- Added SUM(Approval)+(Denial) to Marks - Color, for Activity.
- Added Longitude and Latitude (generated) to Columns and Rows respectively.
- Added all the SUM(Approval) and SUM(Denial) to the Marks - Text, in the same order present in the Source.
-
Approval:
- Added SUM(Approval) to the Marks - Text.
- Added Employer to the rows.
- Did a filter by SUM(Approval), to reduce the number of records.
-
Denial:
- Added SUM(Denial) to the Marks - Text.
- Added Employer to the rows.
- Did a filter by SUM(Denial), to reduce the number of records.
-
List:
- Added all the Measures using this Mark - Text. Formatting:
Continuing Approvals: <SUM(Continuing Approvals)>
Continuing Denials: <SUM(Continuing Denials)>
Initial Approvals: <SUM(Initial Approvals)>
Initial Denials: <SUM(Initial Denials)>
- NAICS
- Added all the Consolidated Measures using this Mark - Text. Formatting:
Approval: <SUM(Approval)>
Denials: <SUM(Denials)>
- Year Over Year:
- Created a Calculated filed called
YOYandAnalysis Year - Added all the Measures to the rows.
- Added Analysis Year to the columns.
- Changed the color schema appropriately.
- Created a Calculated filed called
// YOY
CASE [Fiscal Year] - {MAX([Fiscal Year])}
    WHEN 0 THEN 'TY'
    WHEN -1 THEN 'LY'
    WHEN -2 THEN 'PY'
    WHEN -3 THEN '3Y'
    WHEN -4 THEN '4Y'
    WHEN -5 THEN '5Y'
    WHEN -6 THEN '6Y'
    WHEN -7 THEN '7Y'
    WHEN -8 THEN '8Y'
    WHEN -9 THEN '9Y'
    WHEN -10 THEN '10Y'
    WHEN -11 THEN '11Y'
    WHEN -12 THEN '12Y'
    WHEN -13 THEN '13Y'
    WHEN -14 THEN '14Y'
    WHEN -15 THEN '15Y'
END

// Analysis Year
IF [Fiscal Year] = {MAX([Fiscal Year])}
THEN 'TY (' + STR([Fiscal Year]) + ')'
ELSEIF [Fiscal Year] = {MAX([Fiscal Year])} - 1
THEN 'LY (' + STR([Fiscal Year]) + ')'
ELSEIF [Fiscal Year] < {MAX([Fiscal Year])}
THEN STR(ABS([Fiscal Year] - {MAX([Fiscal Year])})) + 'Y (' + STR([Fiscal Year]) + ')'
ELSE '+' + STR([Fiscal Year] - {MAX([Fiscal Year])}) + 'Y (' + STR([Fiscal Year]) + ')'
END
- Approvals & Denials Trend:
- Organized the Worksheets into this dashboard.
- Added my custom logo, links to LinkedIn, Digital Garden, Online Resume.